
Memphians eager to get “Back to Business” have taken encouragement from declines in the COVID-19 positivity rate.
Given this trend, some are wondering why area mayors are slow to move into “Phase 3” of the re-opening framework.
There are certainly good reasons why Phase 3 should not be delayed:
- Prediction models and the statements of health officials have been wildly inaccurate.
- Businesses have been forced to suspend operations but abortion centers have not.
- A more targeted approach would better protect our most vulnerable loved ones who are at the greatest risk of serious illness and death.
- Demonstrations have revealed exceptions to social distancing guidelines, public gatherings and the mask mandate.
- Officials have driven people into joblessness, poverty and social isolation while running up the public debt and passing out poisoned face coverings.
- There is abundant hospital capacity thanks to the state’s $51.3 million investment in an abandoned property.
All of those arguments aside, Memphis and Shelby County leaders are looking at a handful of indicators to determine next steps, but the positivity rate isn’t one of them.
The positivity rate is simply the percentage of COVID-19 tests that come back positive (meaning it shows they have contracted the virus).
Here are two graphs that show our local positivity rate.
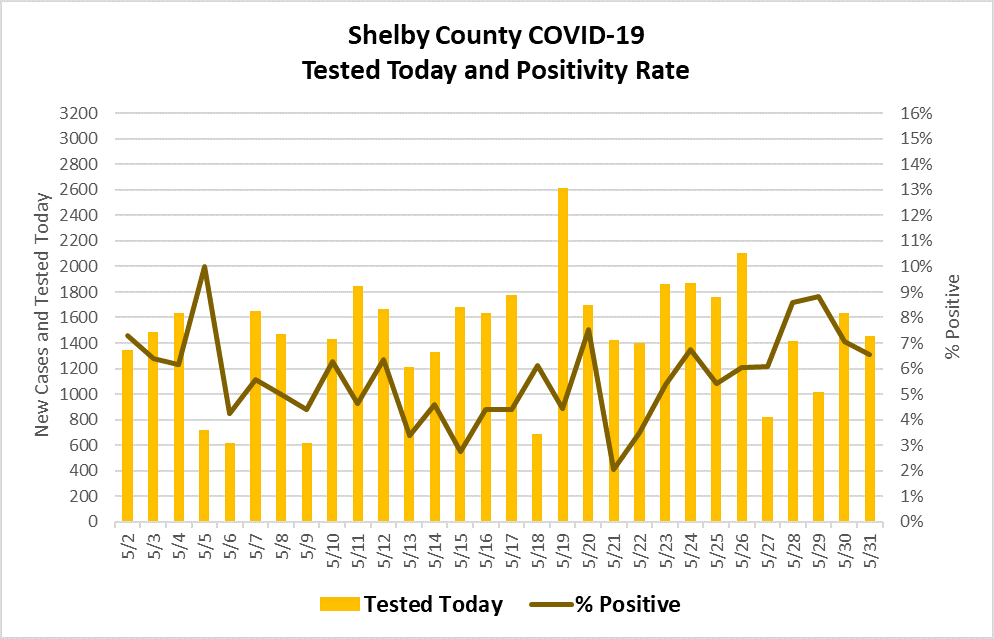
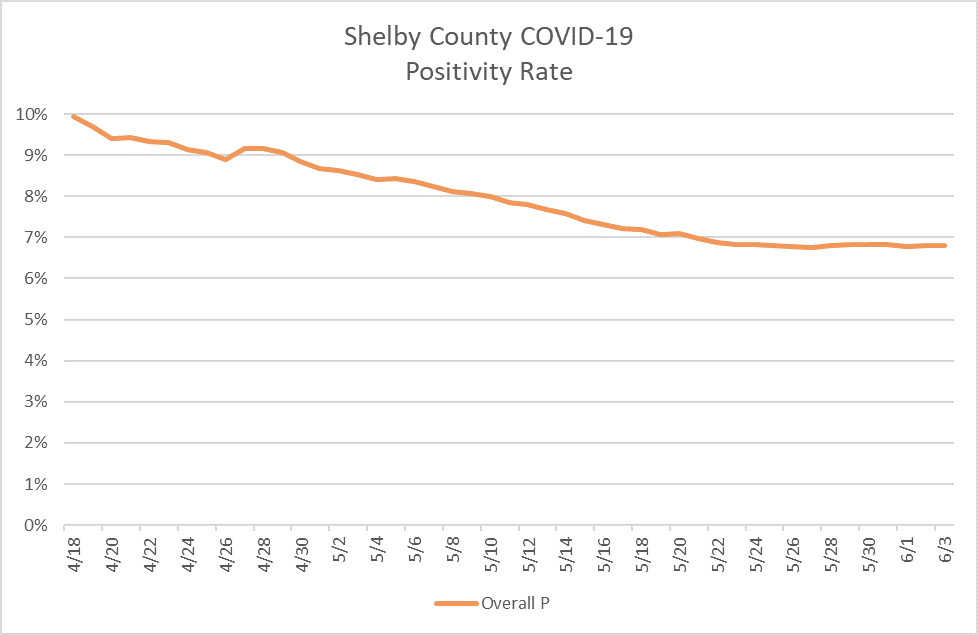
The positivity rate can tell us a little about our testing capacity, and a little about the spread of the disease, but it isn’t a great measure of either one.
Consider an example. Let’s say we test 10 people at a nursing home, and all 10 tests come back positive. That means we have a 100% positivity rate. The next day we test ten more, and only 9 are positive. So our positivity rate has dropped by 10% to 90%. That’s good, right?
In that example, it might be that the other 90 residents weren’t tested but are infected. So it could mean our testing capacity is too low and we need to be testing more people.
Or it might be that the other 90 residents could have been tested but were not tested because they are not sick and the tests would have come back negative if they had been taken. So we could conclude the spread of the disease isn’t as bad as we had feared.
Which scenario is correct? The positivity rate alone can’t tell us.
More useful indicators are testing capacity and the rate of spread. As long as we can test more people than request or need one, our testing capacity is good. And if each infected person spreads the disease to one or fewer people, our case numbers will be manageable.
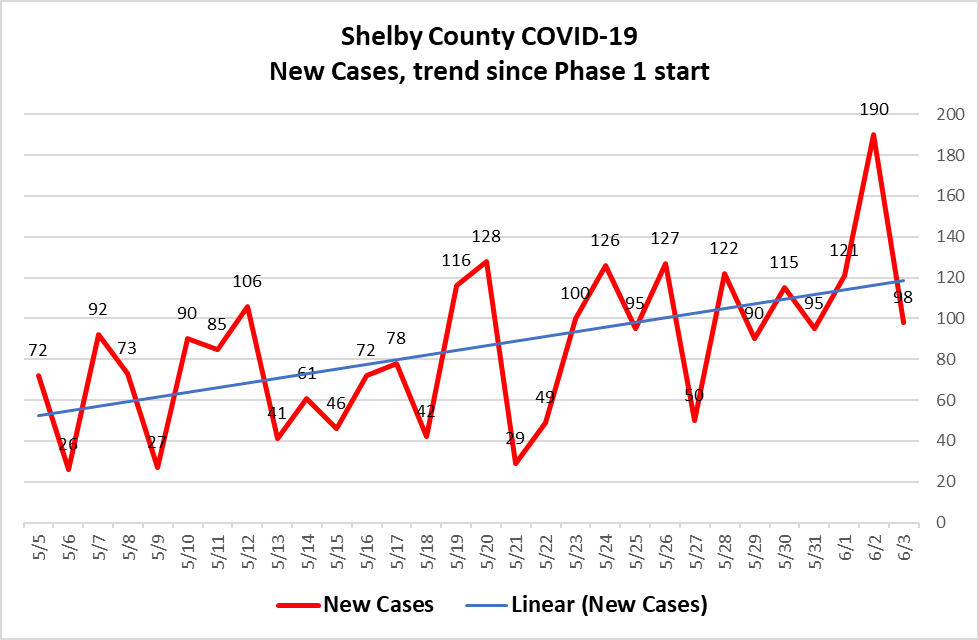
I’ll conclude with the most recent snapshot of our new cases trend. This shows all new cases since the beginning of Phase 1.